As LLM applications continue to evolve (and improve), achieving robust observability is critical for ensuring optimal performance and reliability. However, tracing and storing runtime events in LLM applications is challenging due to their complexity and scale.
The good news is that to address these challenges, we have released MyScale Telemetry (opens new window), which integrates with LangChain Callbacks (opens new window).
This telemetry seamlessly captures trace data from LangChain-based LLM applications and stores it in MyScale (opens new window) 
MyScale Telemetry is an open-source alternative to LangSmith (opens new window)and provides capabilities similar to LangSmith, including tracing and evaluating LLM applications. MyScale Telemetry reduces system complexity and improves data security by utilizing the versatile and powerful MyScale SQL vector database and the widely used Grafana dashboard. Additionally, since MyScaleDB is ClickHouse-compatible, MyScale Telemetry can be directly used with ClickHouse.
Let's take a detailed look at the functions and usage of the MyScale Telemetry system in the following sections.
# How MyScale Telemetry Works
Integrating MyScale Telemetry with LangChain is straightforward. The Callback Handler automatically creates a nested trace for every runtime event in your LangChain application, including:
on_chain_starton_chain_endon_llm_starton_llm_endon_chat_model_starton_retriever_starton_retriever_endon_tool_starton_tool_endon_tool_erroron_chain_erroron_retriever_erroron_llm_error
The collected runtime event data is then organized into trace data, similar to OpenTelemetry trace data (opens new window), and stored in the MyScale database in a dedicated trace data table. See the following SQL script for this trace data table stucture and CREATE TABLE statement.
CREATE TABLE your_database_name.your_table_name
(
    `TraceId` String CODEC(ZSTD(1)),
    `SpanId` String CODEC(ZSTD(1)),
    `ParentSpanId` String CODEC(ZSTD(1)),
    `StartTime` DateTime64(9) CODEC(Delta(8), ZSTD(1)),
    `EndTime` DateTime64(9) CODEC(Delta(8), ZSTD(1)),
    `Duration` Int64 CODEC(ZSTD(1)),
    `SpanName` LowCardinality(String) CODEC(ZSTD(1)),
    `SpanKind` LowCardinality(String) CODEC(ZSTD(1)),
    `ServiceName` LowCardinality(String) CODEC(ZSTD(1)),
    `SpanAttributes` Map(LowCardinality(String), String) CODEC(ZSTD(1)),
    `ResourceAttributes` Map(LowCardinality(String), String) CODEC(ZSTD(1)),
    `StatusCode` LowCardinality(String) CODEC(ZSTD(1)),
    `StatusMessage` String CODEC(ZSTD(1)),
    INDEX idx_trace_id TraceId TYPE bloom_filter(0.001) GRANULARITY 1,
    INDEX idx_res_attr_key mapKeys(ResourceAttributes) TYPE bloom_filter(0.01) GRANULARITY 1,
    INDEX idx_res_attr_value mapValues(ResourceAttributes) TYPE bloom_filter(0.01) GRANULARITY 1,
    INDEX idx_span_attr_key mapKeys(SpanAttributes) TYPE bloom_filter(0.01) GRANULARITY 1,
    INDEX idx_span_attr_value mapValues(SpanAttributes) TYPE bloom_filter(0.01) GRANULARITY 1,
    INDEX idx_duration Duration TYPE minmax GRANULARITY 1
)
ENGINE = MergeTree()
PARTITION BY toDate(StartTime)
ORDER BY (SpanName, toUnixTimestamp(StartTime), TraceId);
# Workflow Overview
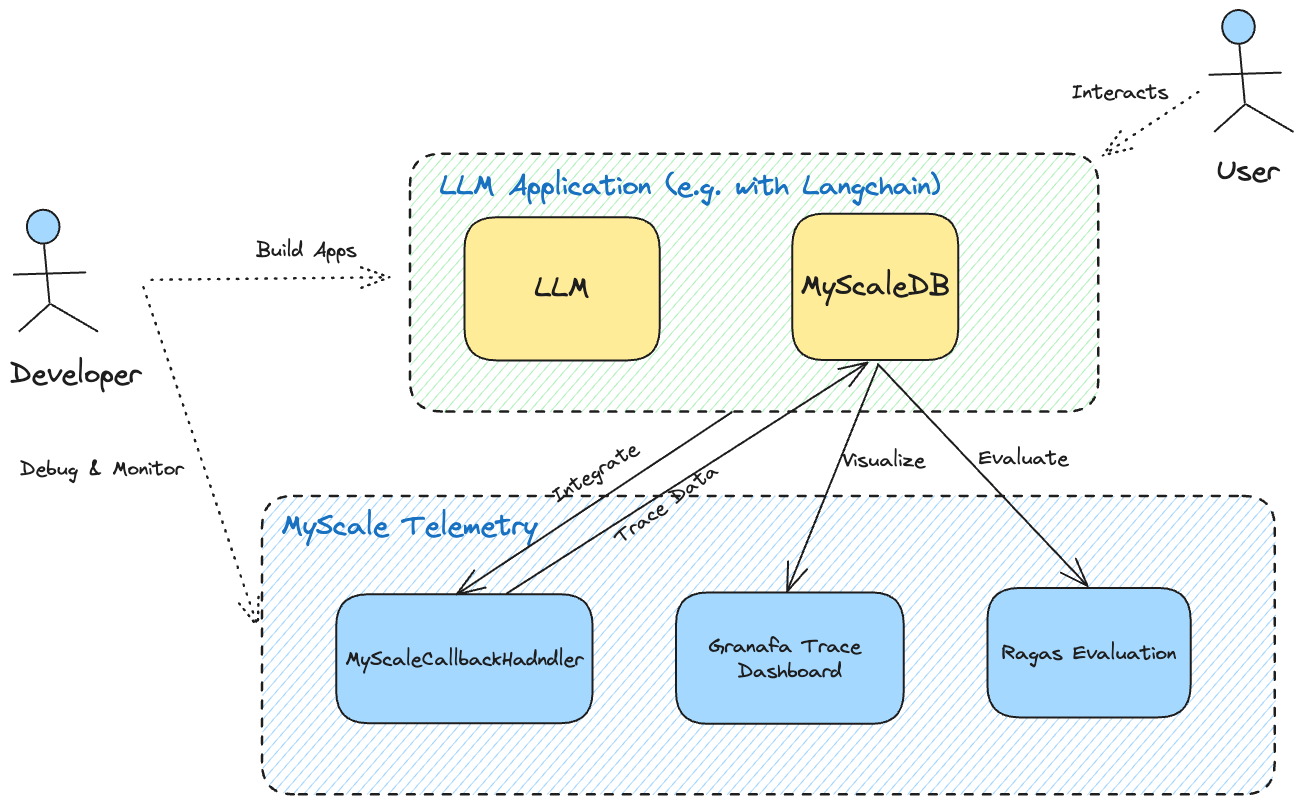 MyScale Telemetry automatically records all trace data generated from user interactions with an LLM application into MyScale Cloud or MyScaleDB. Developers can then visualize this stored trace data in the Grafana Dashboard, facilitating comprehensive debugging and analysis of the LLM application. This trace data can also be fed into an evaluation framework like Ragas for further analysis, aiding the application's optimization.
As a result, MyScale Telemetry is invaluable for developers. It offers a powerful tool for debugging and enhancing LLM applications with minimal performance impact. It provides comprehensive observability insights, allowing developers to understand their application’s behavior and performance deeply.
# Using MyScale Telemetry: A Practical Example
Let's start with MyScale Telemetry by considering the following complete example: setting up MyScaleDB (opens new window) and Grafana Dashboard (opens new window)—for storing and monitoring trace data—to using Ragas (opens new window) to evaluate this data.
Follow these steps to set up and utilize MyScale Telemetry effectively:
# Set up MyScaleDB and Grafana
First, start MyScaleDB and Grafana instances using Docker Compose.
You can find the docker-compose.yml file in this folder (opens new window).
Run the following command to start the containers:
git clone https://github.com/myscale/myscale-telemetry.git
cd myscale-telemetry/deploy/
docker-compose up -d
Alternatively, you can launch a managed MyScaleDB instance on MyScale Cloud (opens new window). If you choose this option, disable the local MyScaleDB instance startup with the following command:
docker-compose up --scale myscaledb=0 -d
# Install Required Packages
Next, install the MyScale Telemetry package along with LangChain and LangChain OpenAI integration and Ragas using pip:
pip install myscale-telemetry langchain_openai ragas
# Construct a Simple Chain
The next step is to construct a simple LangChain chain and integrate it with MyScaleCallbackHandler to collect the trace data as follows:
import os
from myscale_telemetry.handler import MyScaleCallbackHandler
from operator import itemgetter
from langchain_core.output_parsers import StrOutputParser
from langchain_core.prompts import ChatPromptTemplate
from langchain_openai import ChatOpenAI, OpenAIEmbeddings
from langchain_community.vectorstores import MyScale
from langchain_community.vectorstores.myscale import MyScaleSettings
from langchain_core.runnables import RunnableConfig

# set up the environment variables for OpenAI and MyScale Cloud/MyScaleDB:
os.environ["OPENAI_API_KEY"] = "YOUR_OPENAI_KEY"
os.environ["MYSCALE_HOST"] = "YOUR_MYSCALE_HOST"
os.environ["MYSCALE_PORT"] = "YOUR_MYSCALE_HOST"
os.environ["MYSCALE_USERNAME"] = "YOUR_MYSCALE_USERNAME"
os.environ["MYSCALE_PASSWORD"] = "YOUR_MYSCALE_PASSWORD"

# create a vector store and retriever using MyScale and OpenAI embeddings:
texts = [
  "Harrison worked at Kensho.",
  "Alice is a software engineer.",
  "Bob enjoys hiking on weekends.",
  "Claire is studying data science.",
  "David works at a tech startup.",
  "Eva loves playing the piano.",
  "Frank is a graphic designer.",
  "Grace is an artificial intelligence researcher.",
  "Henry is a freelance writer.",
  "Isabel is learning machine learning."
]

myscale_settings = MyScaleSettings()
myscale_settings.index_type = 'SCANN'
vectorstore = MyScale.from_texts(texts, embedding=OpenAIEmbeddings(), config=myscale_settings)
retriever = vectorstore.as_retriever()

# set up the llm and prompt template:
model = ChatOpenAI()
template = """Answer the question based only on the following context:
{context}

Question: {question}

"""
prompt = ChatPromptTemplate.from_template(template)

# create the chain
chain = (
    {
    "context": itemgetter("question") | retriever,
    "question": itemgetter("question"),
    }
    | prompt
    | model
    | StrOutputParser()
)

# integrate MyScaleCallbackHandler to capture trace data during the chain execution:
chain.invoke({"question": "where did harrison work"}, config=RunnableConfig(
    callbacks=[
        MyScaleCallbackHandler()
    ]
))
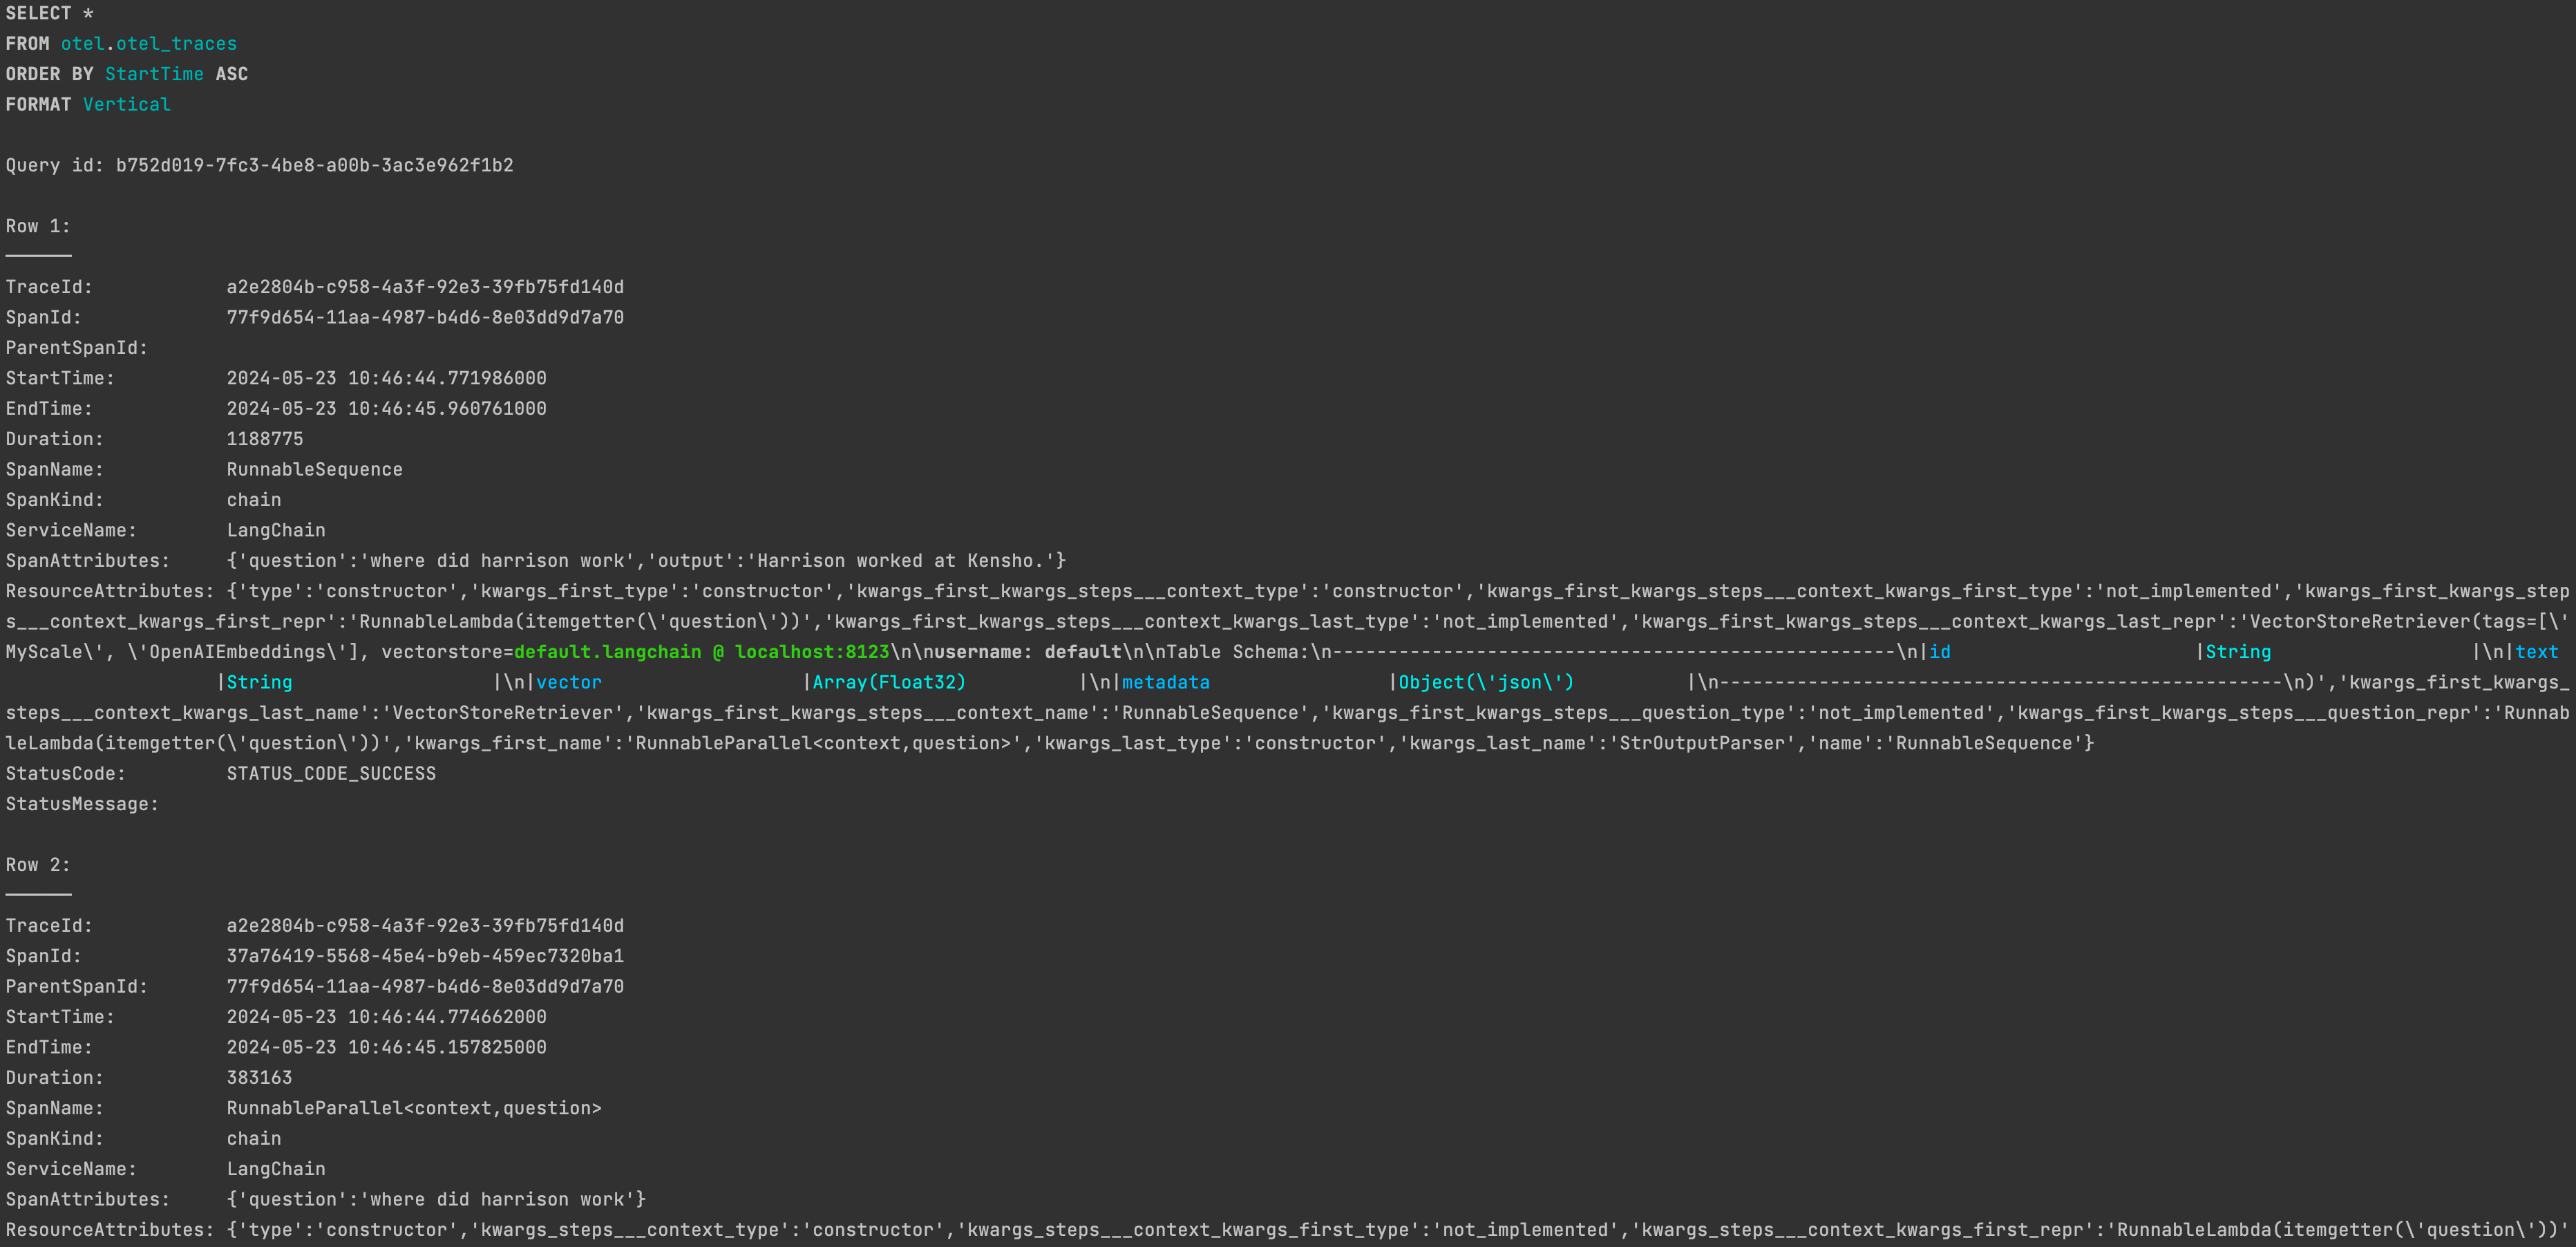
After running successfully, you will find the corresponding trace data in the otel.otel_traces table in MyScaleDB.
Refer to the MyScale Telemetry Custom Parameters documentation (opens new window) to customize MyScaleCallbackHandler.
# Observability
To display trace data collected through the MyScale Telemetry from the LLM Application runtime easily and clearly, we also provide a Grafana Trace Dashboard (opens new window). The dashboard allows users to monitor the status of the LLM Application which is similar to LangSmith, making it easier to debug and improve its performance.
The Docker Compose example launches a Grafana instance at http://localhost:3000 (opens new window). Use the username admin and password admin to log in.
# Set up the Trace Dashboard
After you have collected trace data using the MyScale Telemetry Handler, follow these steps to set up the MyScale Trace Dashboard in Grafana:
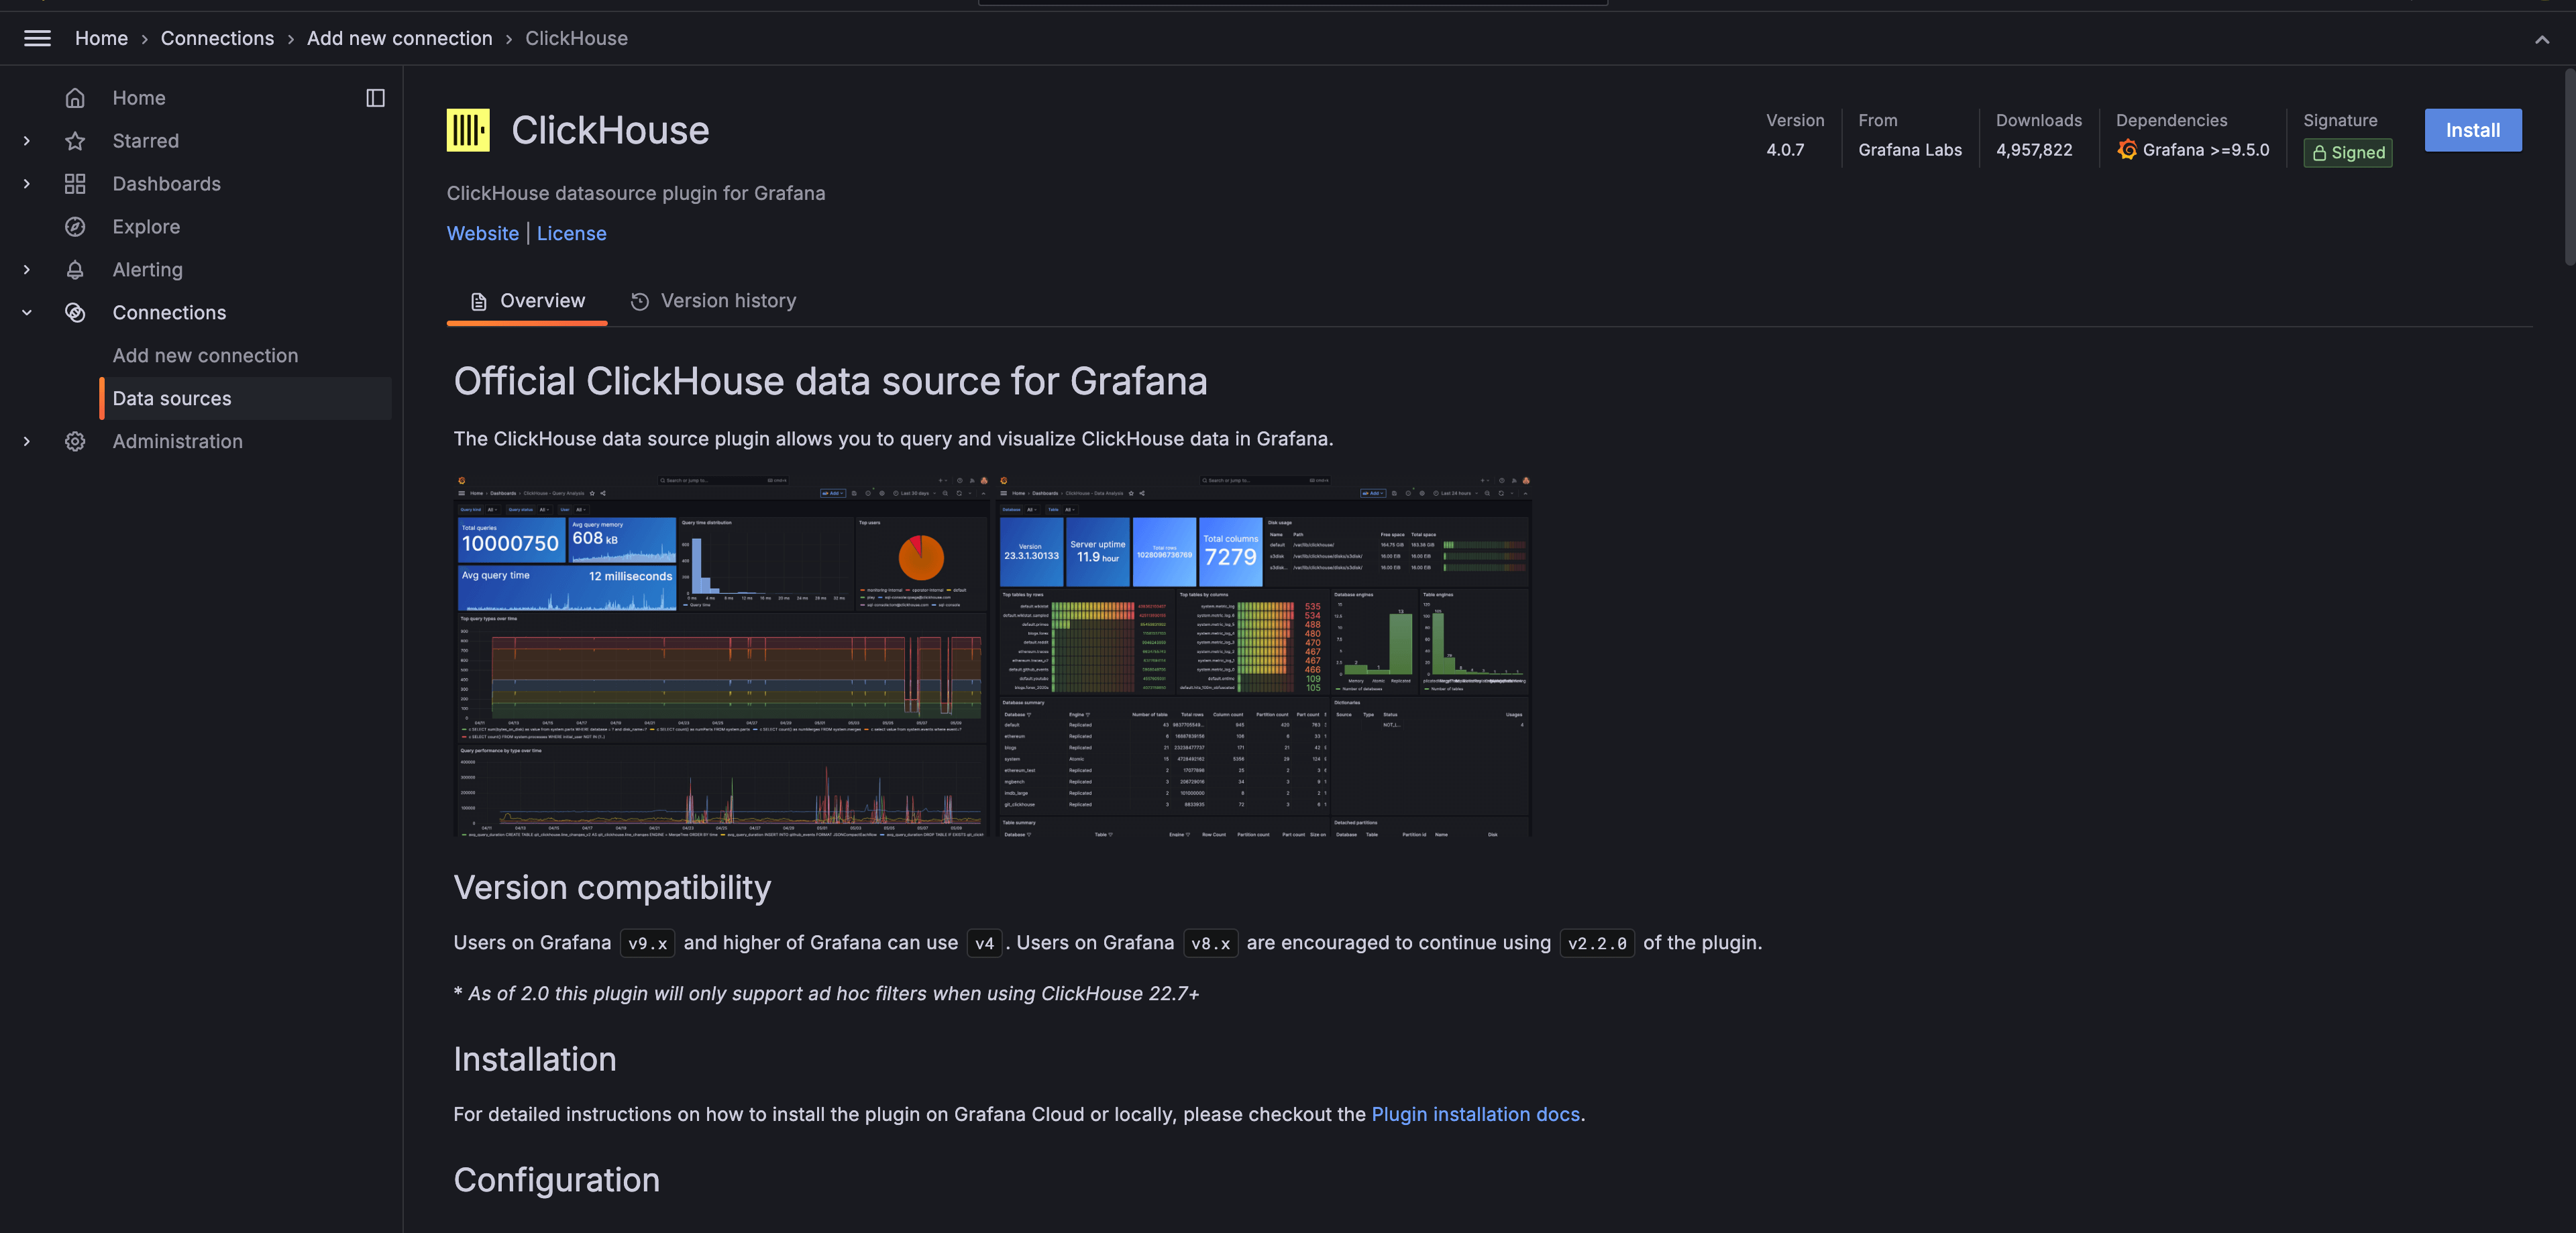
Install the Grafana-clickhouse-datasource Plugin (opens new window):
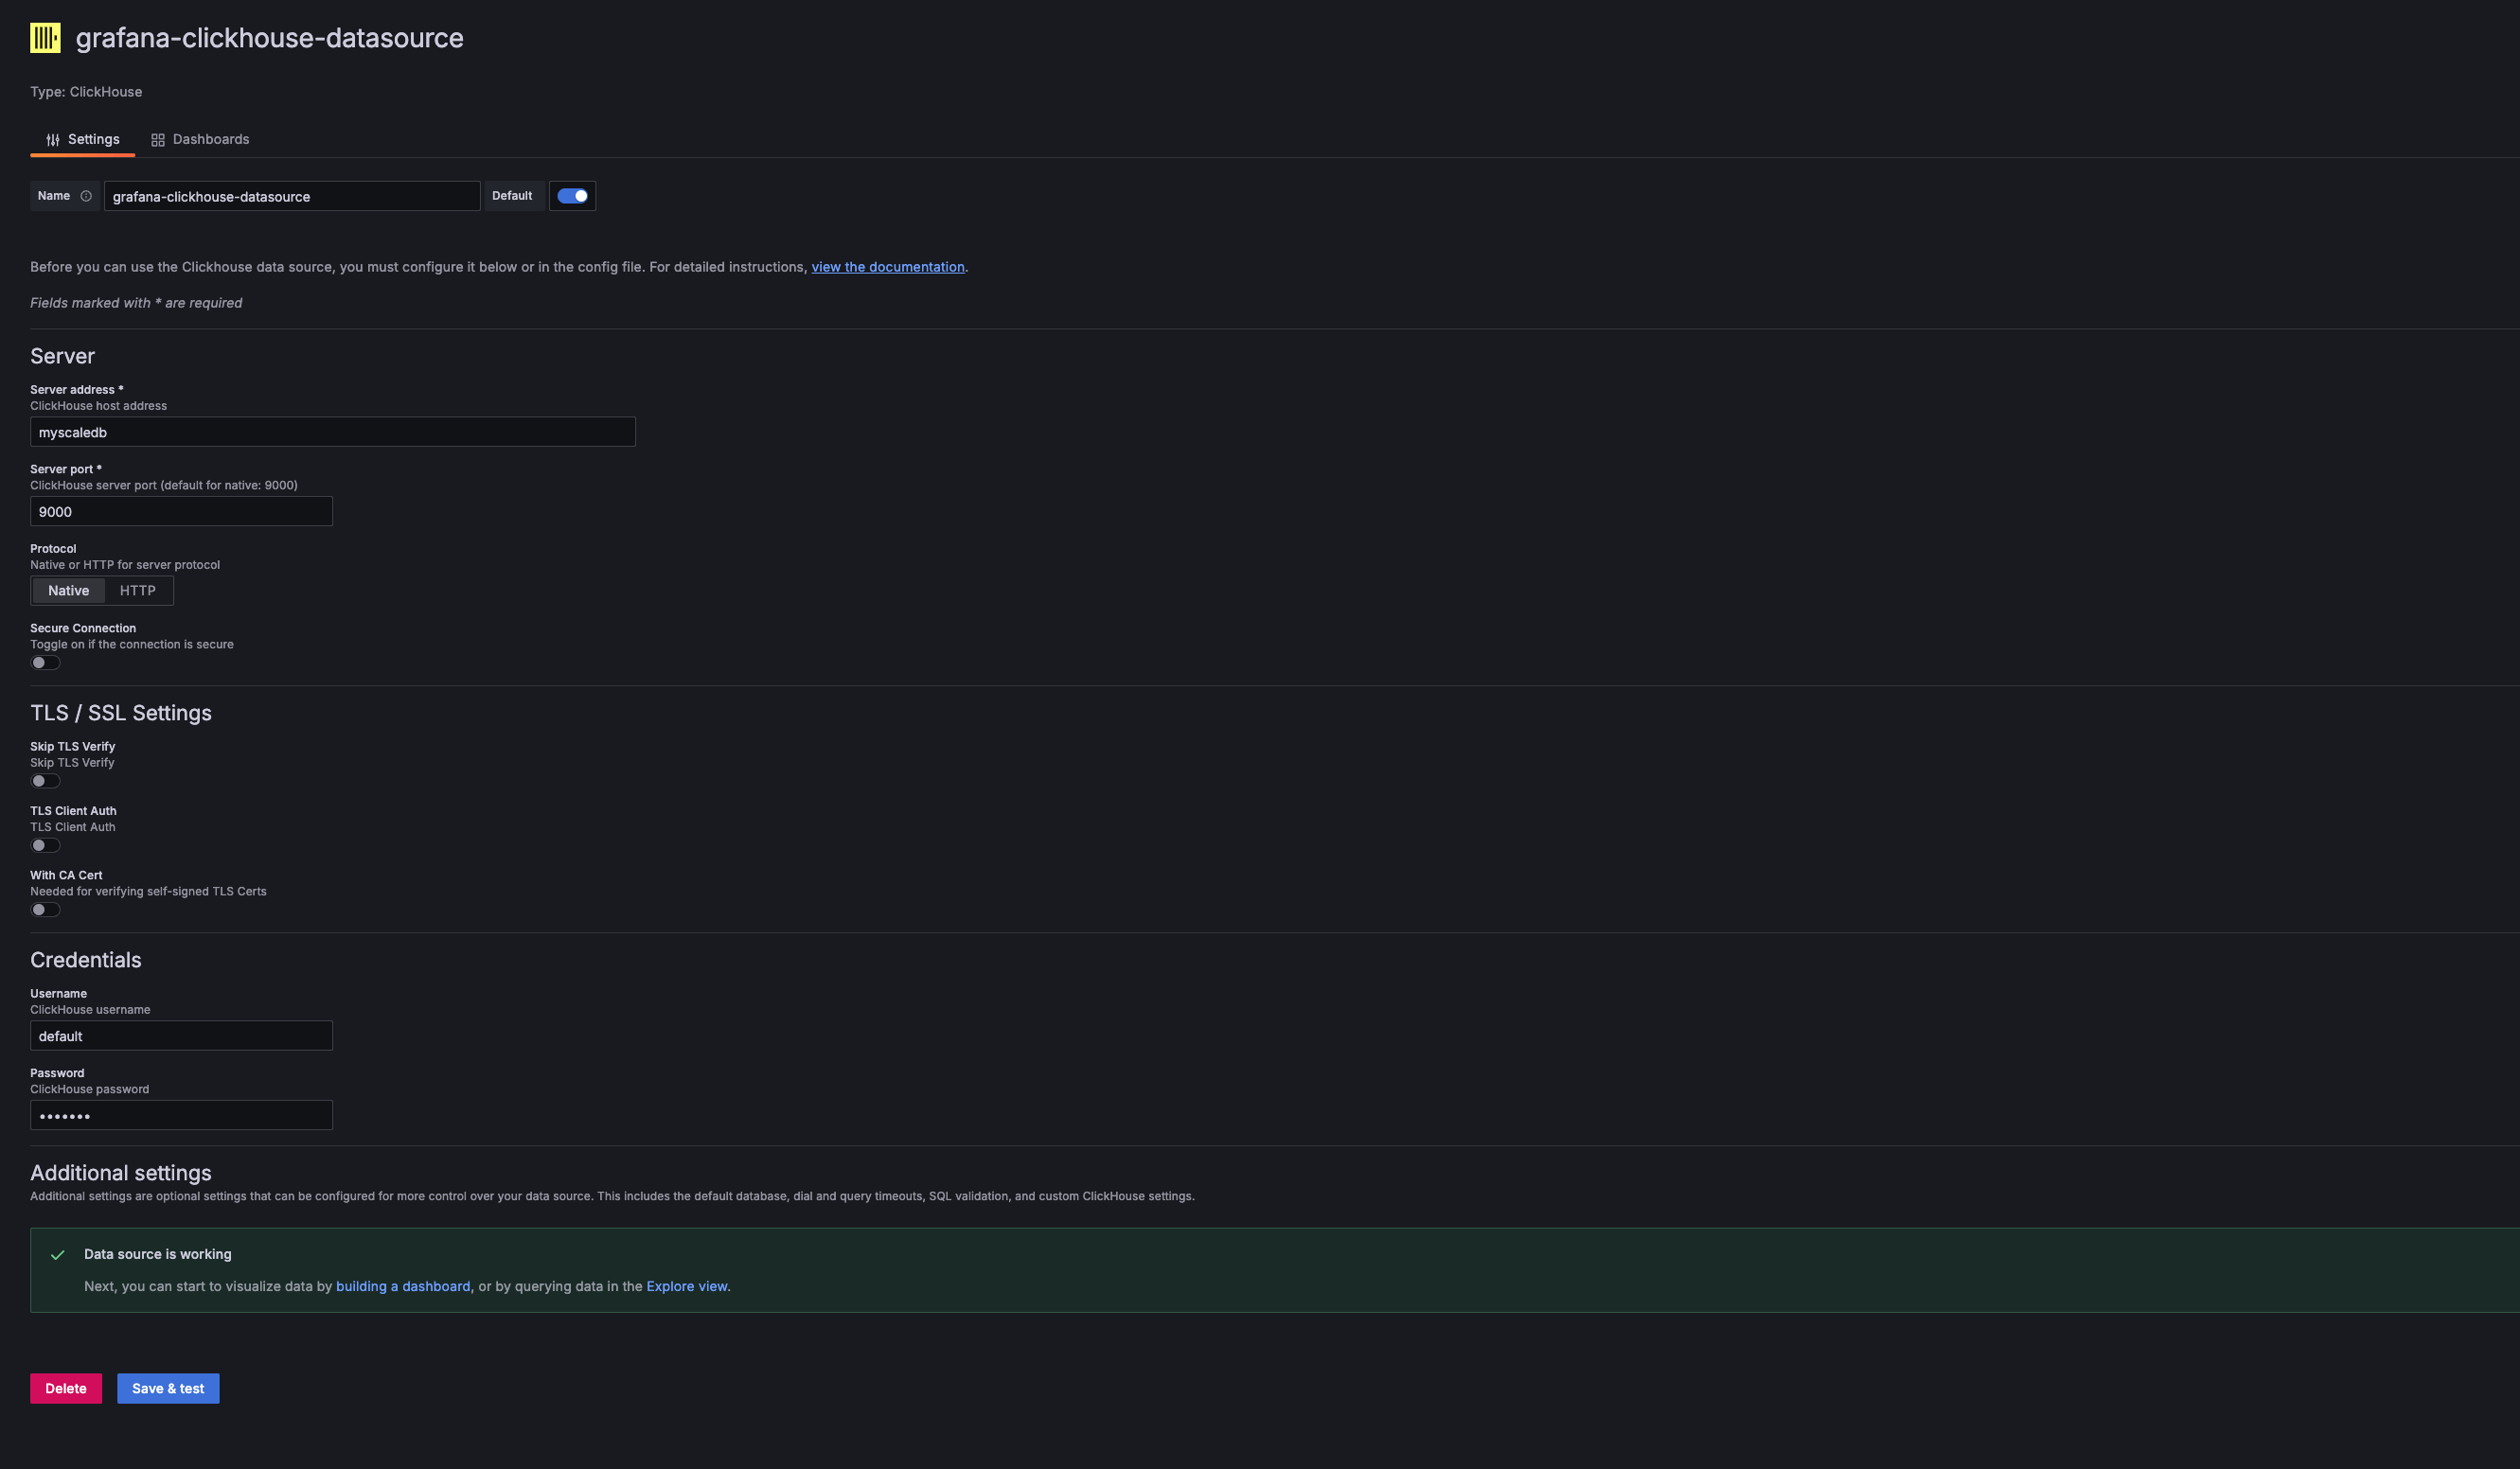
Add a New ClickHouse Data Source in Grafana:
Add a new ClickHouse data source in the Grafana data source settings. The Server Address, Server Port, Username, and Password should correspond to the Host, Port, Username, and Password of the MyScaleDB used. For the Docker Compose example provided, these values are:
- Address:
myscaledb - Port:
9000 - Username:
default - Password:
default

- Address:
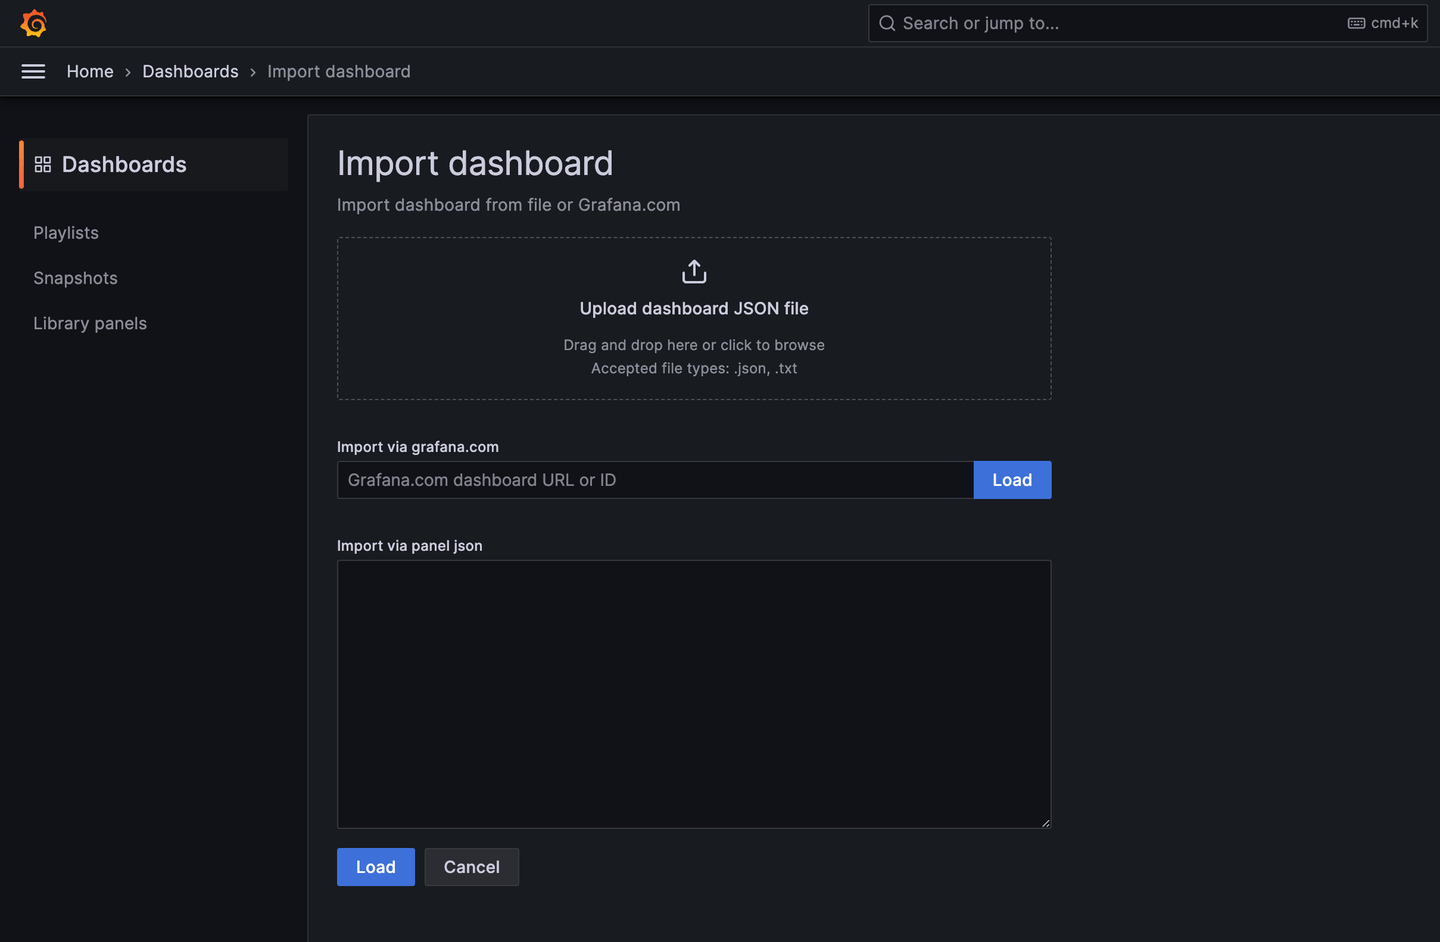
Import the MyScale Trace Dashboard:
Once the ClickHouse Data Source is added, you can import the MyScale Trace Dashboard (opens new window).
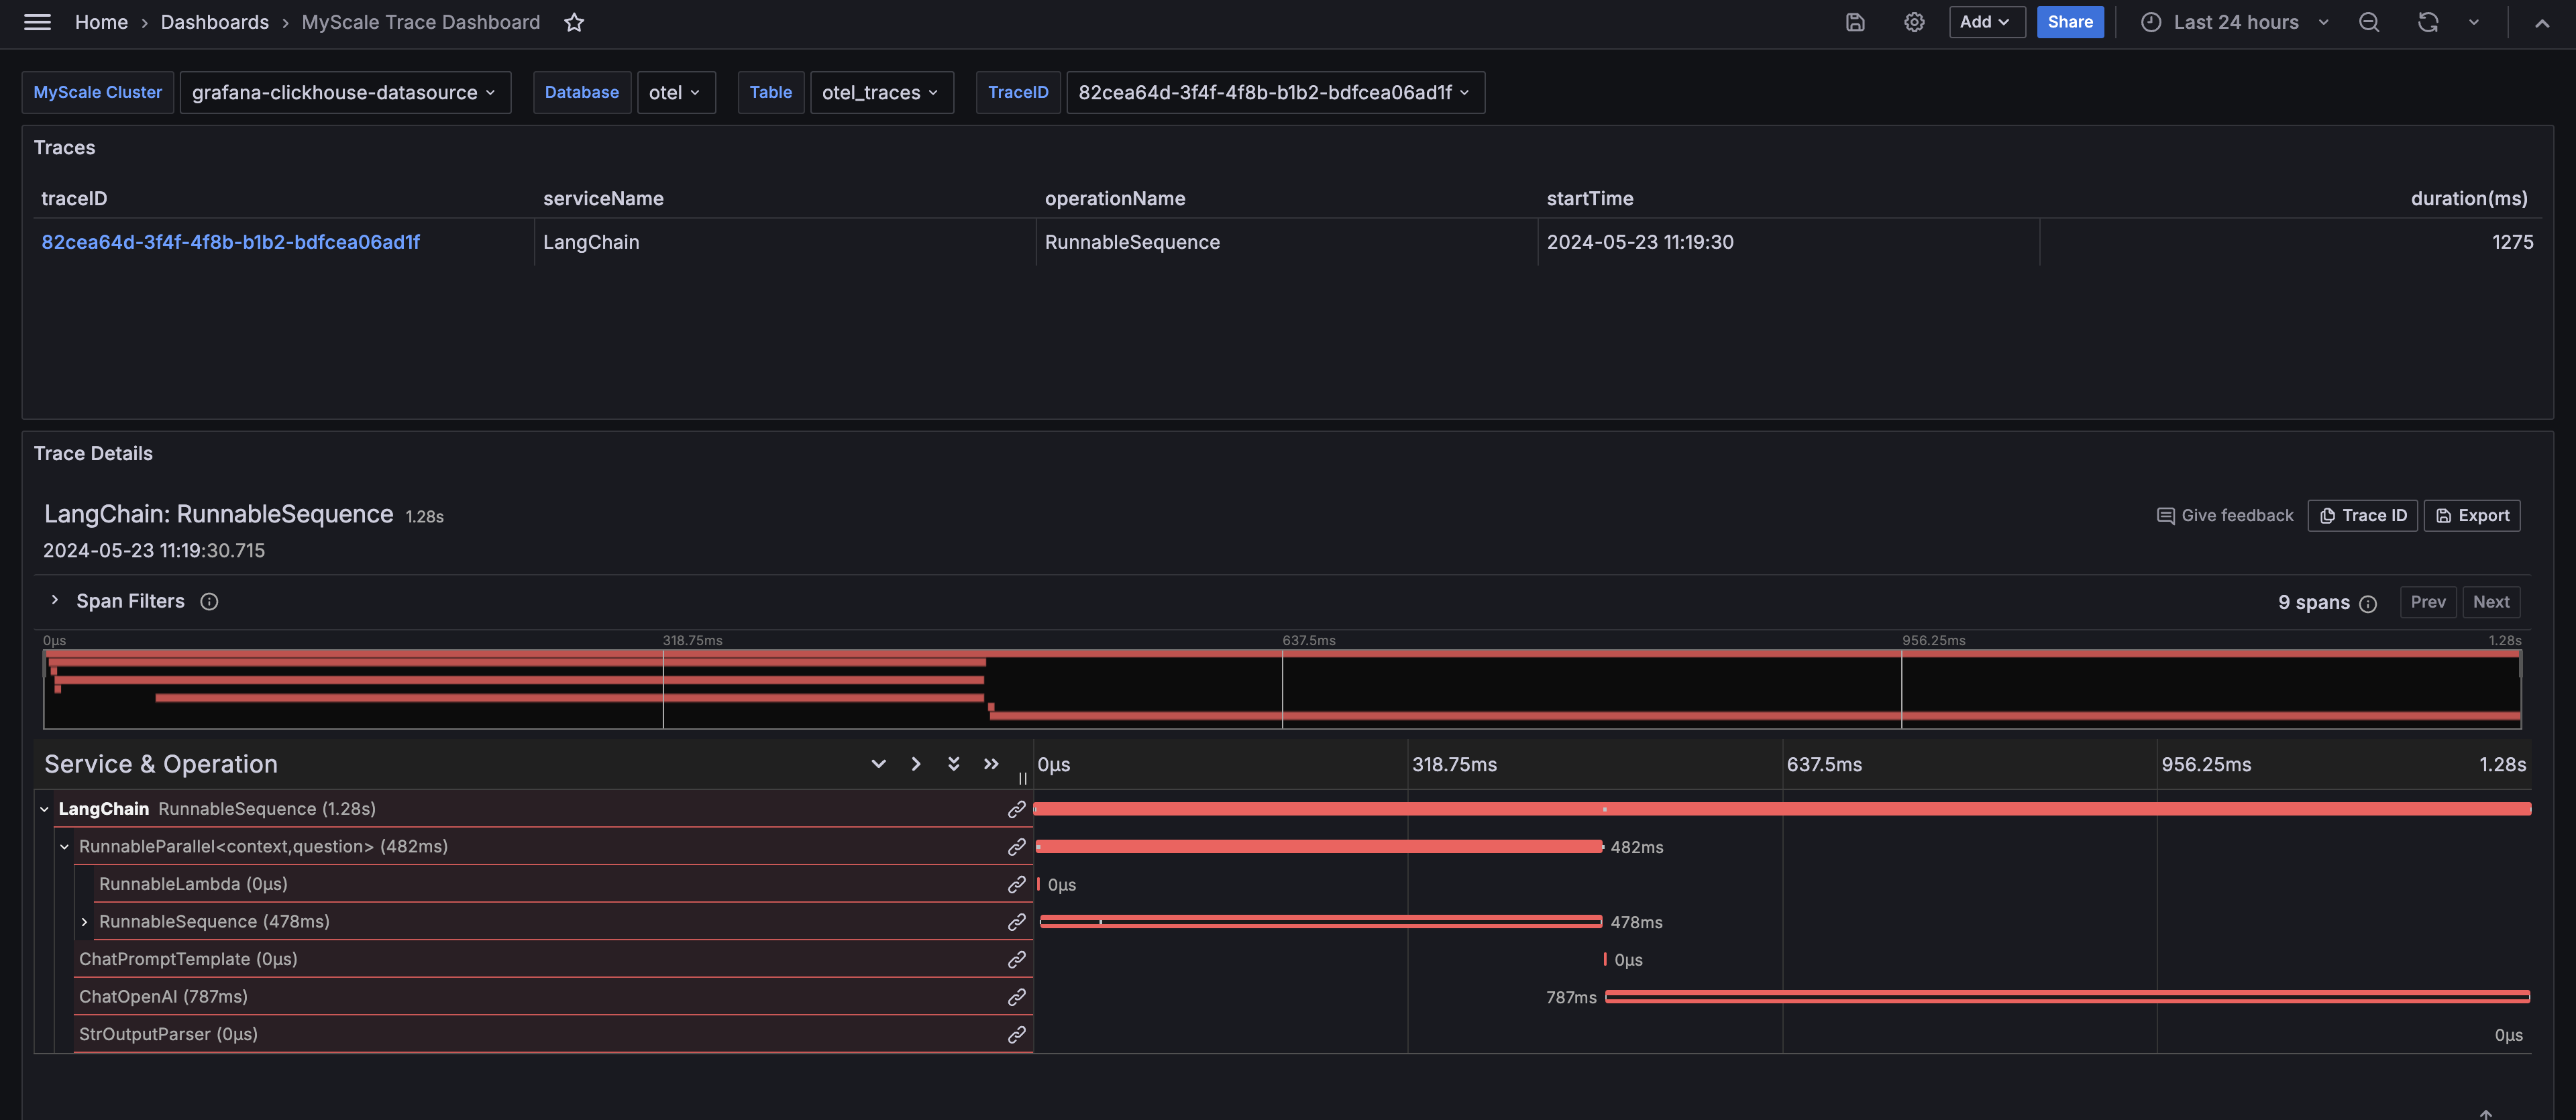
Configure the Dashboard:
After importing the MyScale Trace Dashboard, select the MyScale Cluster (ClickHouse Data Source Name), the database name, table name, and TraceID of the trace you want to analyze. The dashboard will then display the Traces Table and the Trace Details Panel of the selected trace.
# Insights from the MyScale Trace Dashboard
The MyScale Trace Dashboard, similar to LangSmith, provides comprehensive insights into the runtime behavior of your LLM application. It displays critical information that helps you debug, optimize, and understand your applications' performance.
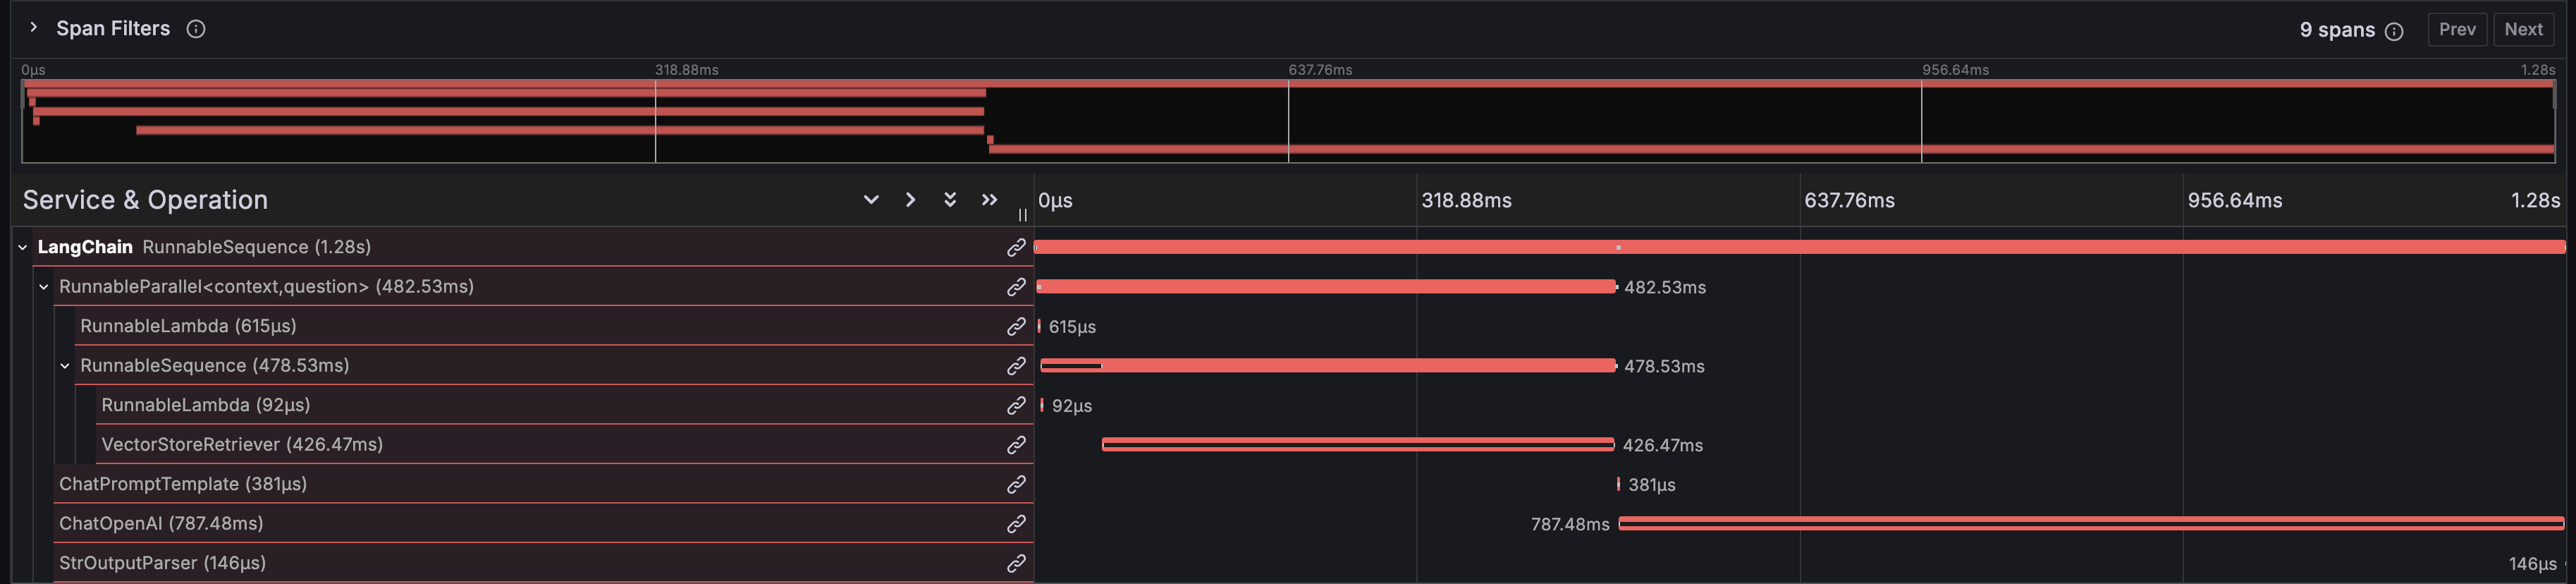
# Function Execution Times
The dashboard shows the execution time for each function in your LangChain application, helping you identify performance bottlenecks.
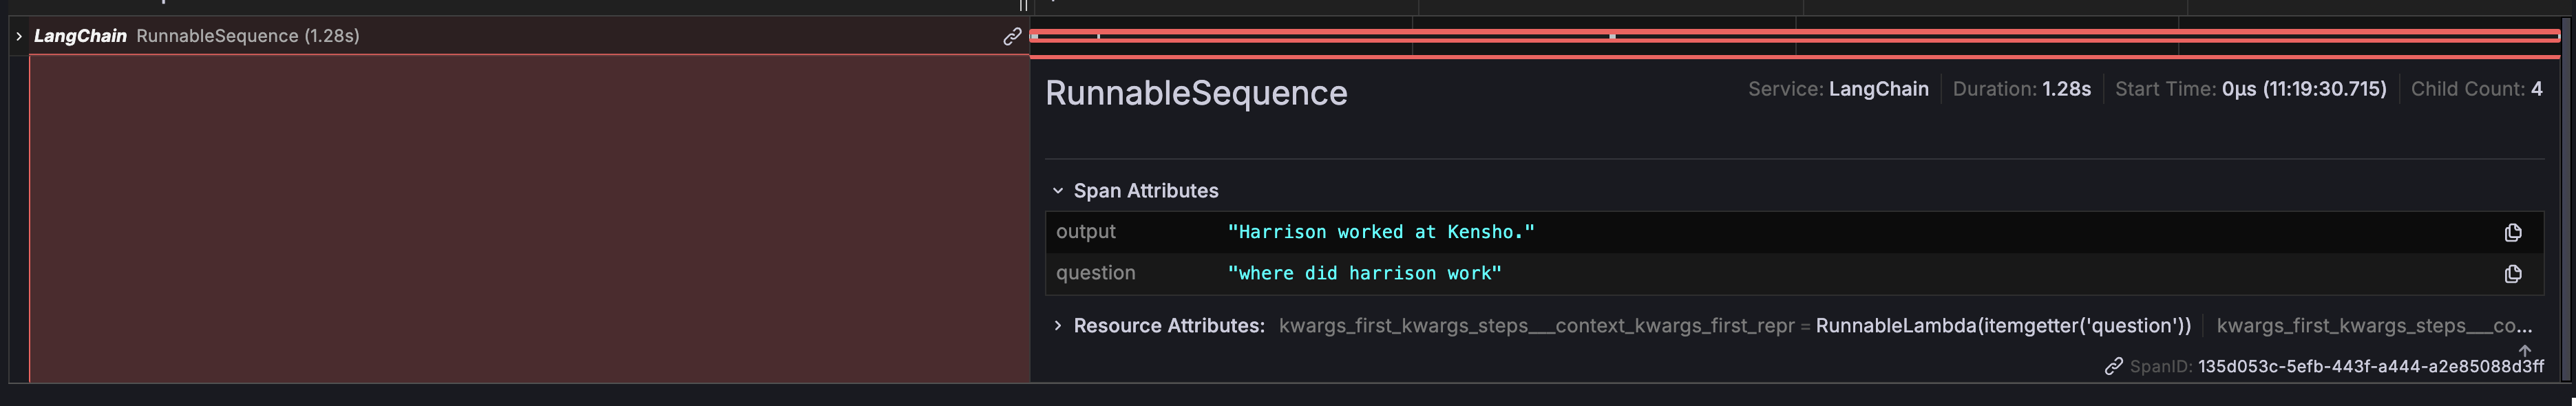
# Input and Output
The dashboard provides a detailed view of your chain's overall input and output of your chain, making it easy to track the flow of data through your application.
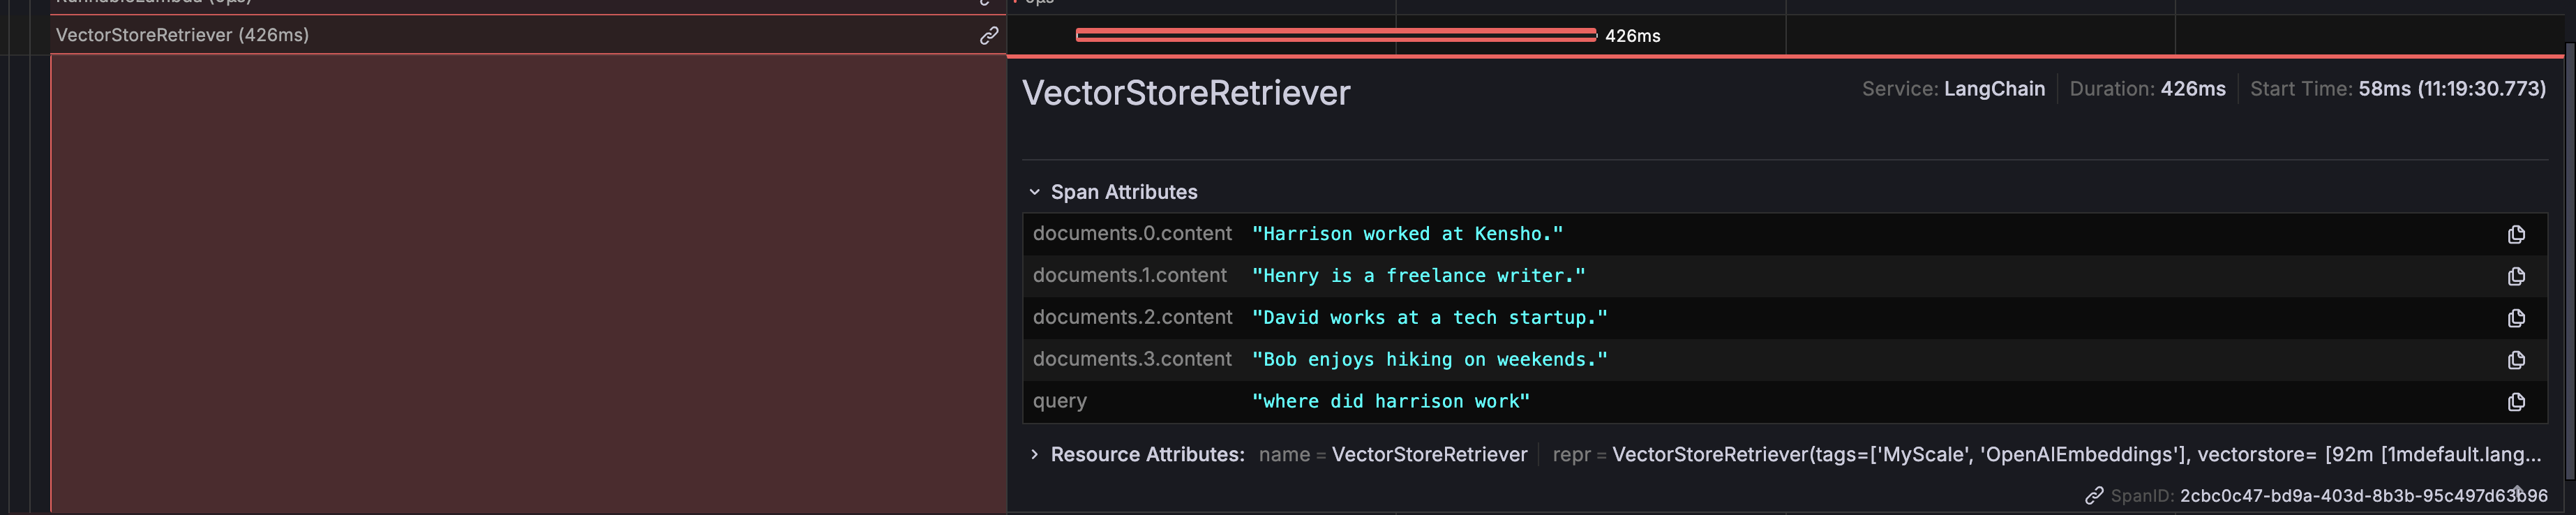
# DB Retriever Returns
It displays the specific data returned by the database retriever, allowing you to verify that the correct data is being fetched and used in your prompts.
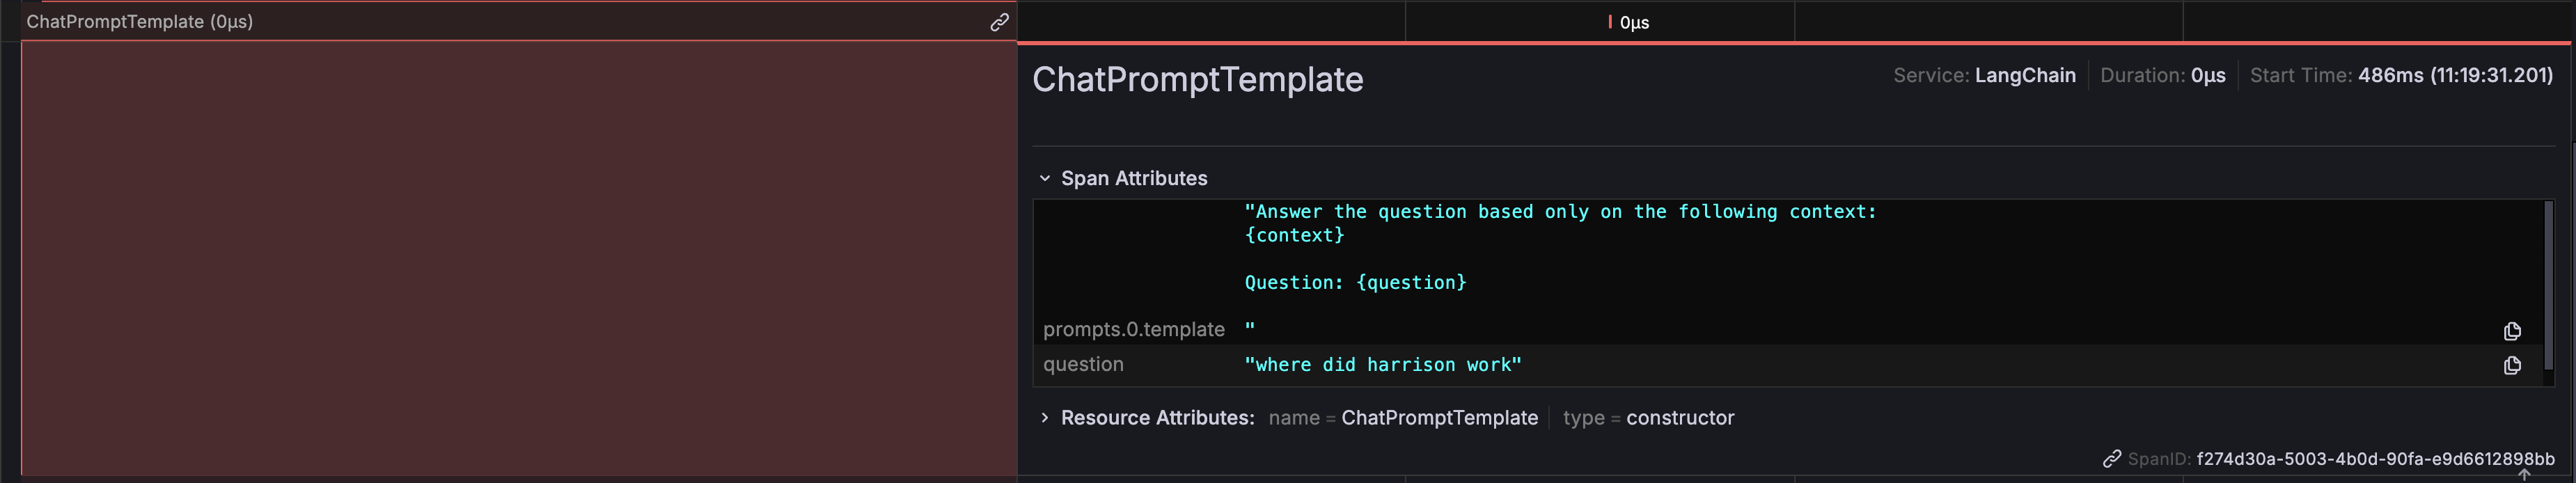
# Prompt Information
You can see the exact prompts being generated and sent to the LLM, which is essential for ensuring the correctness and relevance of the questions being asked.
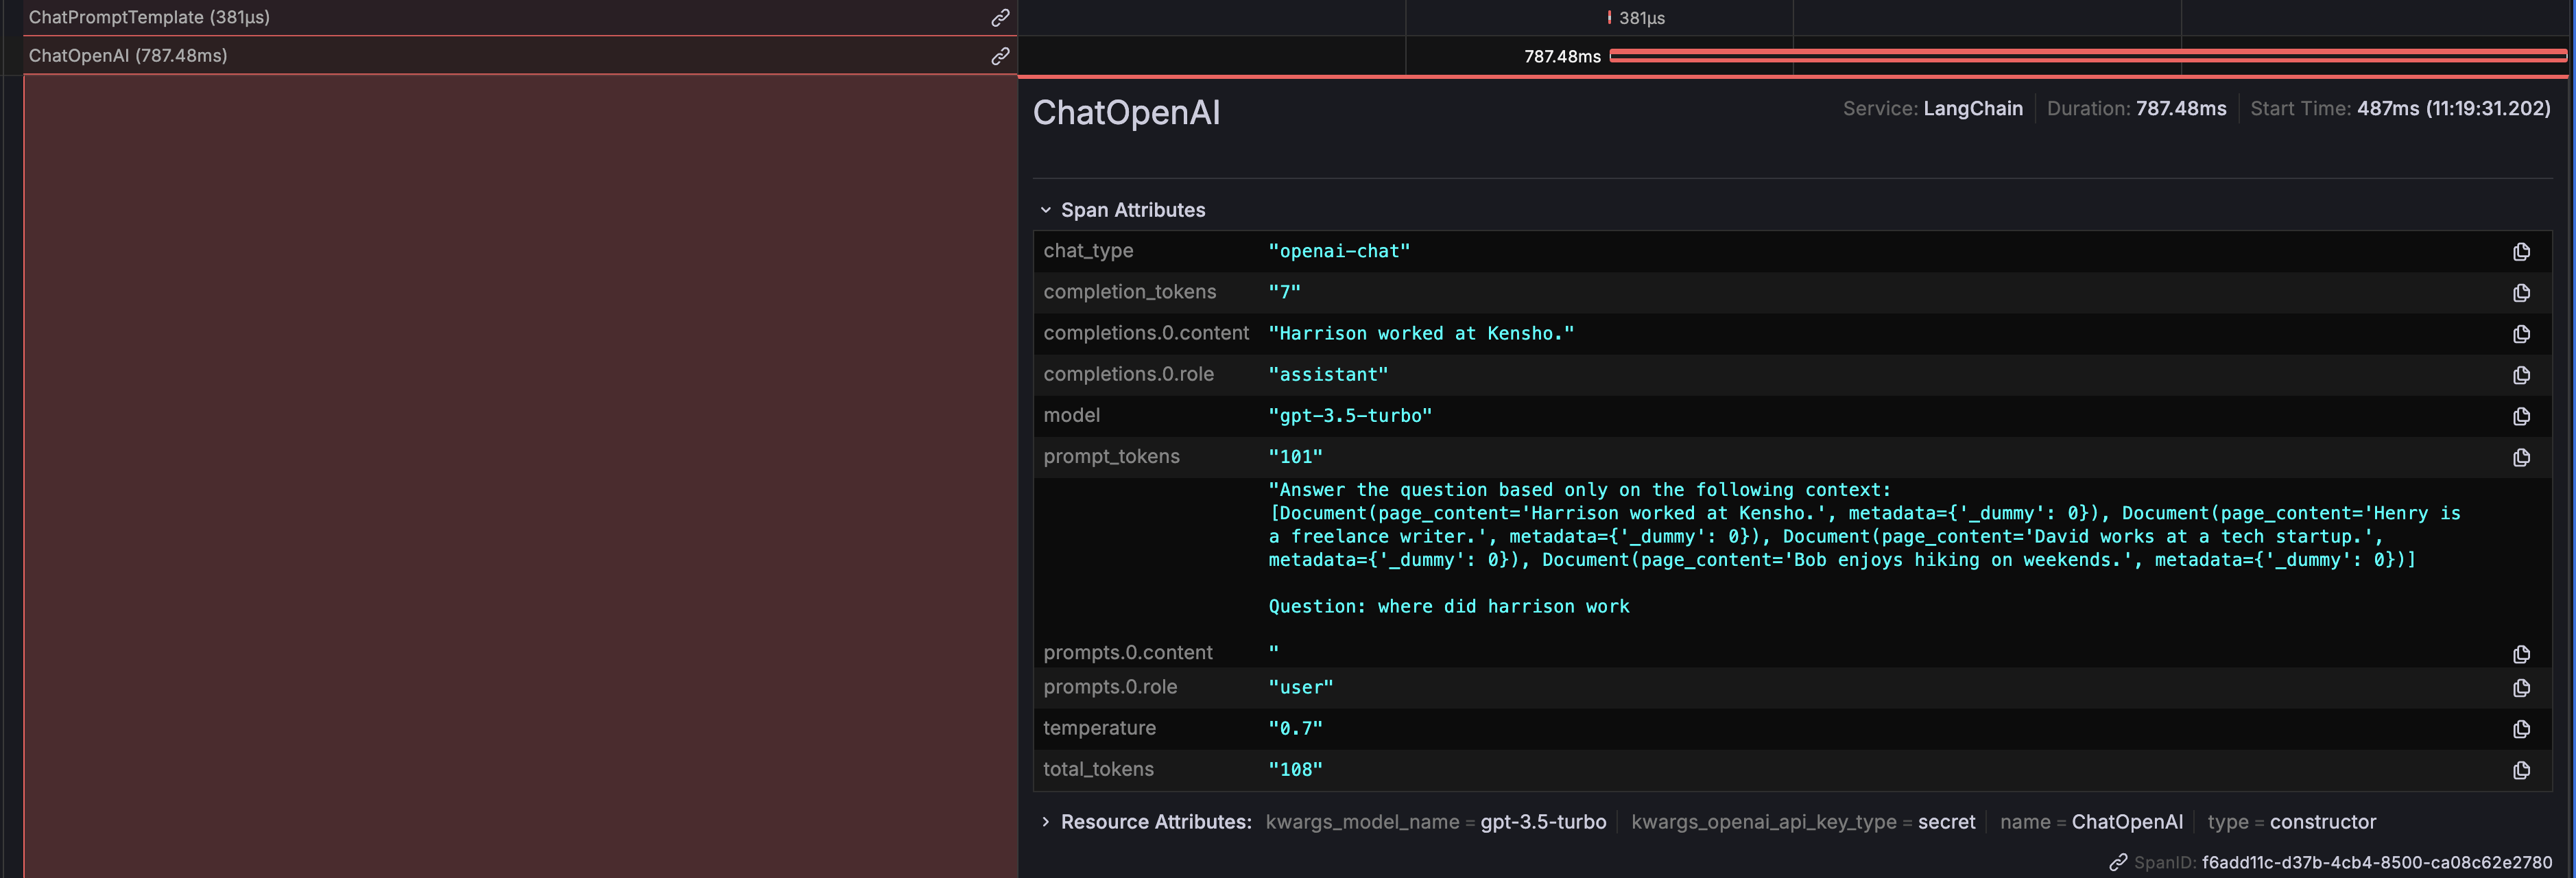
# ChatOpenAI Outputs
The outputs generated by ChatOpenAI are also displayed, providing clarity on how the LLM respondes to the prompts. Additionally, token usage details are shown to help you monitor and optimize the cost associated with API calls to the LLM.
# Evaluation With Ragas
The span data stored in MyScaleDB can be used to analyze and evaluate their RAG pipeline with Ragas (opens new window), which is a popular open-source RAG evaluation framework.
The following Python code illustrates how to score a trace with Ragas by evaluating the retrieved contexts and the generated answer:
import os
from datasets import Dataset
from ragas import evaluate
from ragas.metrics import faithfulness, answer_relevancy, context_utilization
from clickhouse_connect import get_client


def score_with_ragas(query, chunks, answer):
  test_dataset = Dataset.from_dict({"question": [query], "contexts": [chunks], "answer": [answer]})
  result = evaluate(test_dataset, metrics=[faithfulness, answer_relevancy, context_utilization])
  return result


def evaluate_trace(question, topk, client, database_name, table_name):
  trace_id, answer = client.query(
    f"SELECT TraceId, SpanAttributes['output'] as Answer FROM {database_name}.{table_name} WHERE SpanAttributes['question'] = '{question}' AND ParentSpanId = ''"
  ).result_rows[0]

  span_dict = client.query(
    f"SELECT SpanAttributes FROM {database_name}.{table_name} WHERE TraceId = '{trace_id}' AND SpanKind = 'retriever'"
  ).result_rows[0][0]

  contexts = [span_dict.get(f"documents.{i}.content") for i in range(topk)]

  print(score_with_ragas(question, contexts, answer))


test_question = "where did harrison work"
client = get_client(
  host=os.getenv("MYSCALE_HOST"),
  port=int(os.getenv("MYSCALE_PORT")),
  username=os.getenv("MYSCALE_USERNAME"),
  password=os.getenv("MYSCALE_PASSWORD"),
)
evaluate_trace(test_question, 4, client, "otel", "otel_traces")
After running the example, you can evaluate the performance of your RAG pipeline using the scores provided by Ragas.


# Conclusion
MyScale Telemetry offers a robust, open-source solution for improving the observability and evaluation of LLM applications. By integrating seamlessly with LangChain Callbacks, it captures detailed trace data and stores it in MyScaleDB, making it easier to diagnose issues, optimize performance, and understand application behavior.
The MyScale Trace Dashboard in Grafana provides clear visualizations of this trace data, helping you monitor and debug your LLM applications effectively. Key insights include function execution times, input and output tracking, DB retriever returns, prompt information, ChatOpenAI outputs, and token usage.
Additionally, integrating Ragas with MyScale Telemetry allows for comprehensive evaluation of RAG pipelines. Using the trace data stored in MyScaleDB, Ragas can assess metrics such as faithfulness, answer relevancy, and context utilization, ensuring high-quality results and continuous improvement.
Why not try out MyScale Telemetry and Grafana Dashboard today to take full advantage of these powerful tools? Feel free to reach out to our support team in MyScale Discord (opens new window) with any questions or if you need further assistance.