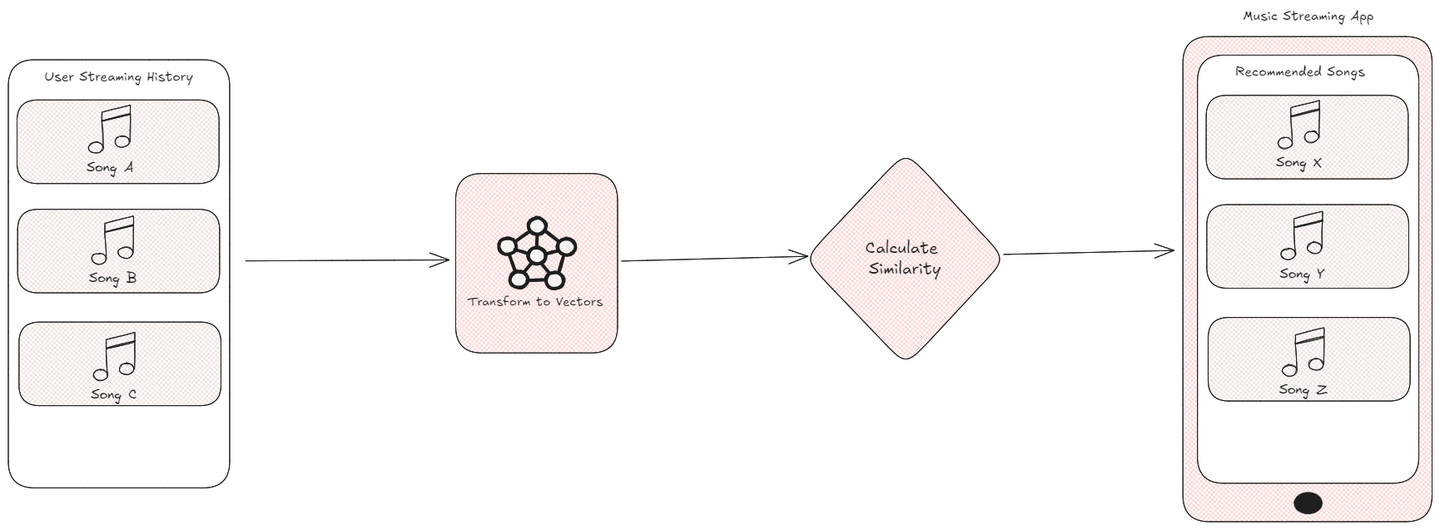
In the modern digital age, personalized suggestions are vital for enhancing user interactions. For instance, a music streaming application utilizes your listening habits to recommend new songs that align with your taste, genre, or mood. However, how do these systems decide which songs are most suitable for you?

The answer lies in transforming these data points into vectors and calculating their similarity using specific metrics. By comparing the vectors representing songs, products, or user behaviours, algorithms can effectively measure their closely related features. This process is fundamental in the fields of machine learning (opens new window) and artificial intelligence (opens new window), where similarity metrics enable systems to deliver accurate recommendations, cluster similar data, and identify nearest neighbours, ultimately creating a more personalized and engaging experience for users.
# What Are Similarity Metrics?
Similarity metrics are instruments utilized to determine the level of similarity or dissimilarity between two entities. These objects could encompass text documents, images, or data points within a dataset. Consider similarity metrics as a tool for assessing the closeness of relationships between items. They play a crucial role in various sectors, such as machine learning, by aiding computers in recognizing patterns in data, clustering similar items, and providing suggestions. For instance, when attempting to discover films akin to one you enjoy, similarity measurements assist in determining this by examining the characteristics of diverse films.

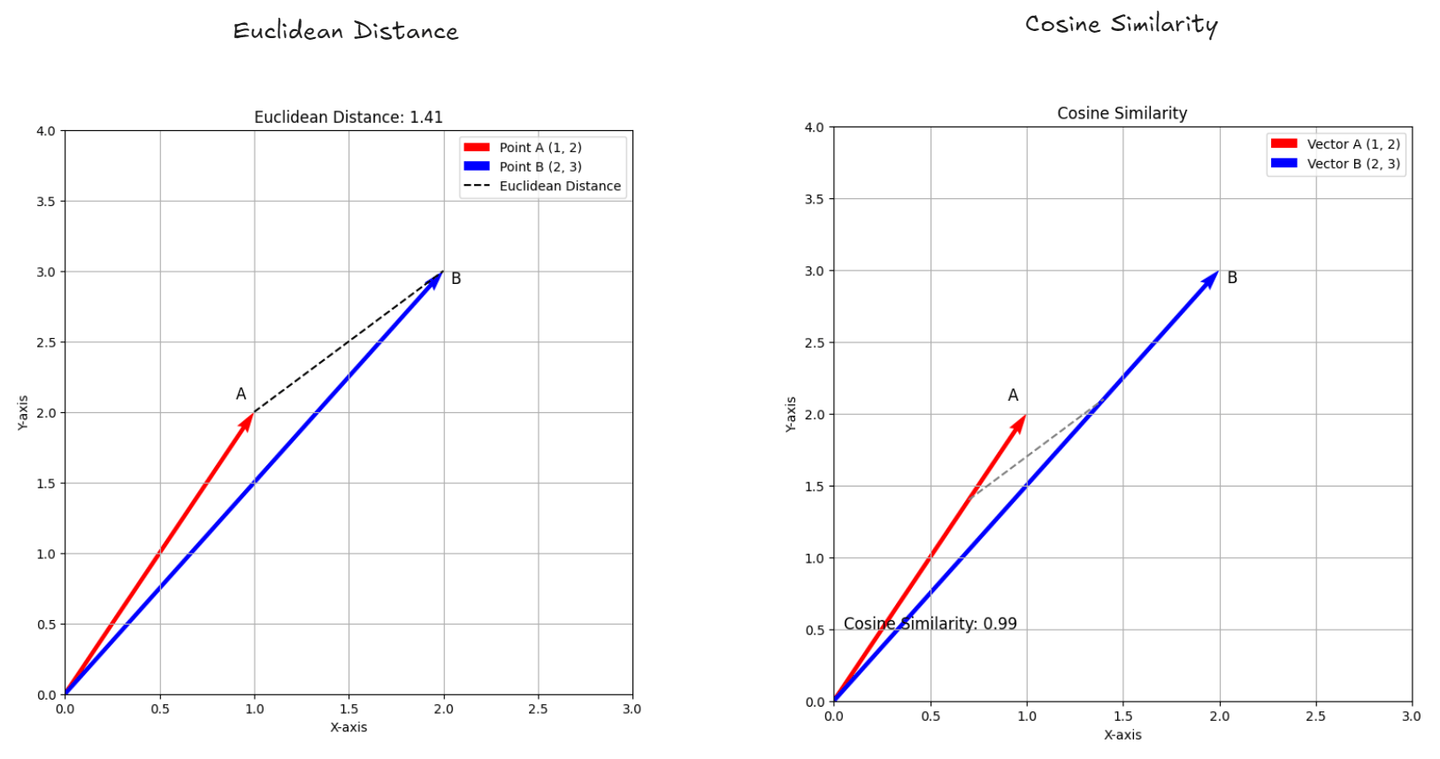
- Euclidean Distance: (opens new window) This measures how far apart two points are in space, like measuring the straight line between two locations on a map. It tells you the exact distance between them.
- Cosine Similarity: (opens new window) This checks how similar two lists of numbers (like scores or features) are by looking at the angle between them. If the angle is small, it means the lists are very similar, even if they are different lengths. It helps you understand how closely related two things are based on their direction.
Now let’s explore both in detail to understand how they work.
# Euclidean Distance
The Euclidean Distance quantifies the distance between two points in a multi-dimensional space, measuring their separation and revealing similarity based on spatial distance. This measurement is especially valuable in online shopping platforms that suggest products to customers depending on their browsing and buying habits. Each product can be depicted as a point in a multi-dimensional space here, where different dimensions represent aspects like price, category, and user ratings.
The system computes the Euclidean Distance between product vectors when a user looks at or buys specific items. When two products are closer in distance, they are considered to be more alike, which assists the system in suggesting items that closely match the user's preferences.
# Formula:
The Euclidean Distance d between two points A(x1,y1) and B(x2,y2) in two-dimensional space is given by:
For n-dimensional space, the formula generalizes to:
The formula calculates the distance by taking the square root of the sum of the squared differences between each corresponding dimension of the two points. Essentially, it measures how far apart the two points are in a straight line, making it a straightforward way to evaluate similarity.
# Coding example
Now let’s code an example that generates a graph to calculate Euclidean Distance:
import numpy as np
import matplotlib.pyplot as plt

# Define two points in 2D space
point_A = np.array([1, 2])
point_B = np.array([2, 3])

# Calculate Euclidean Distance
euclidean_distance = np.linalg.norm(point_A - point_B)

# Create a figure and axis
fig, ax = plt.subplots(figsize=(8, 8))

# Plot the points
ax.quiver(0, 0, point_A[0], point_A[1], angles='xy', scale_units='xy', scale=1, color='r', label='Point A (1, 2)')
ax.quiver(0, 0, point_B[0], point_B[1], angles='xy', scale_units='xy', scale=1, color='b', label='Point B (2, 3)')

# Set the limits of the graph
ax.set_xlim(0, 3)
ax.set_ylim(0, 4)

# Add grid
ax.grid()

# Add labels
ax.annotate('A', point_A, textcoords="offset points", xytext=(-10,10), ha='center', fontsize=12)
ax.annotate('B', point_B, textcoords="offset points", xytext=(10,-10), ha='center', fontsize=12)

# Draw a line representing Euclidean Distance
ax.plot([point_A[0], point_B[0]], [point_A[1], point_B[1]], 'k--', label='Euclidean Distance')

# Add legend
ax.legend()

# Add title and labels
ax.set_title(f'Euclidean Distance: {euclidean_distance:.2f}')
ax.set_xlabel('X-axis')
ax.set_ylabel('Y-axis')

# Show the plot
plt.show()
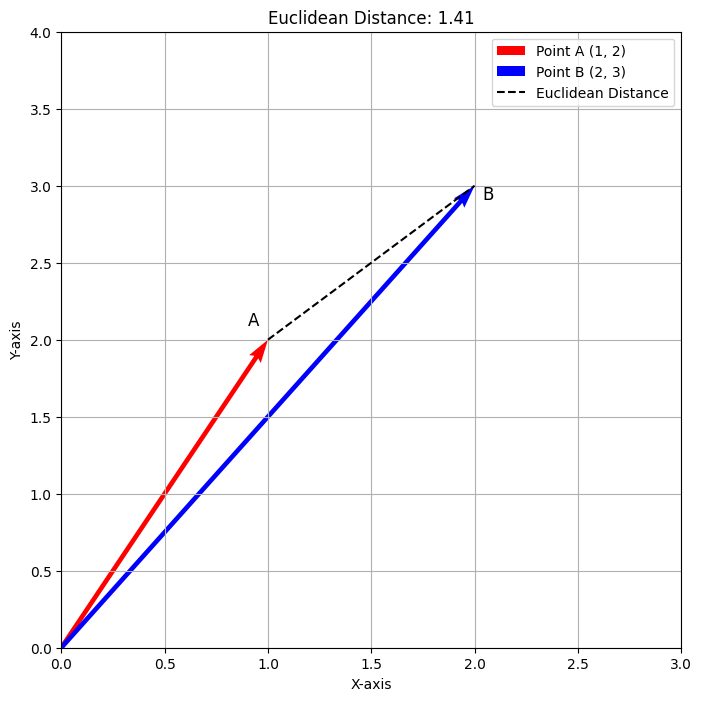
Upon executing this code it will generate the following output.

The plot above illustrates the Euclidean Distance between the points A(1,2) and B(2,3). The red vector denotes Point A, the blue vector denotes Point B, and the dashed line indicates the distance, approximately 1.41. This visualization provides a clear representation of how Euclidean Distance measures the direct path between the two points.
# Cosine Similarity
Cosine Similarity is a metric used to measure how similar two vectors are, regardless of their magnitude. It quantifies the cosine of the angle between two non-zero vectors in an n-dimensional space, providing insight into their directional similarity. This measurement is particularly useful in recommendation systems, such as those used by content platforms like Netflix or Spotify, where it helps suggest movies or songs based on user preferences. In this context, each item (e.g., movie or song) can be represented as a vector of features, such as genre, ratings, and user interactions.
When a user interacts with specific items, the system computes the Cosine Similarity between the corresponding item vectors. If the cosine value is close to 1, it indicates a high degree of similarity, helping the platform recommend items that align with the user’s interests.
# Formula:
The Cosine Similarity S between two vectors A and B is calculated as follows:
Where:
- A⋅B is the dot product of the vectors.
- ∥A∥ and ∥B∥ are the magnitudes (or norms) of the vectors.
This formula computes the cosine of the angle between the two vectors, effectively measuring their similarity based on direction rather than magnitude.
# Coding Example
Now let’s code an example that calculates Cosine Similarity and visualizes the vectors:
import numpy as np
import matplotlib.pyplot as plt

# Define two vectors in 2D space
vector_A = np.array([1, 2])
vector_B = np.array([2, 3])

# Calculate Cosine Similarity
dot_product = np.dot(vector_A, vector_B)
norm_A = np.linalg.norm(vector_A)
norm_B = np.linalg.norm(vector_B)

cosine_similarity = dot_product / (norm_A * norm_B)

# Create a figure and axis
fig, ax = plt.subplots(figsize=(8, 8))

# Plot the vectors
ax.quiver(0, 0, vector_A[0], vector_A[1], angles='xy', scale_units='xy', scale=1, color='r', label='Vector A (1, 2)')
ax.quiver(0, 0, vector_B[0], vector_B[1], angles='xy', scale_units='xy', scale=1, color='b', label='Vector B (2, 3)')

# Draw the angle between vectors
angle_start = np.array([vector_A[0] * 0.7, vector_A[1] * 0.7])
angle_end = np.array([vector_B[0] * 0.7, vector_B[1] * 0.7])
ax.plot([angle_start[0], angle_end[0]], [angle_start[1], angle_end[1]], 'k--', color='gray')

# Annotate the angle and cosine similarity
ax.text(0.5, 0.5, f'Cosine Similarity: {cosine_similarity:.2f}', fontsize=12, color='black', ha='center')

# Set the limits of the graph
ax.set_xlim(0, 3)
ax.set_ylim(0, 4)

# Add grid
ax.grid()

# Add annotations for the vectors
ax.annotate('A', vector_A, textcoords="offset points", xytext=(-10, 10), ha='center', fontsize=12)
ax.annotate('B', vector_B, textcoords="offset points", xytext=(10, -10), ha='center', fontsize=12)

# Add legend
ax.legend()

# Add title and labels
ax.set_title('Cosine Similarity Visualization')
ax.set_xlabel('X-axis')
ax.set_ylabel('Y-axis')

# Show the plot
plt.show()
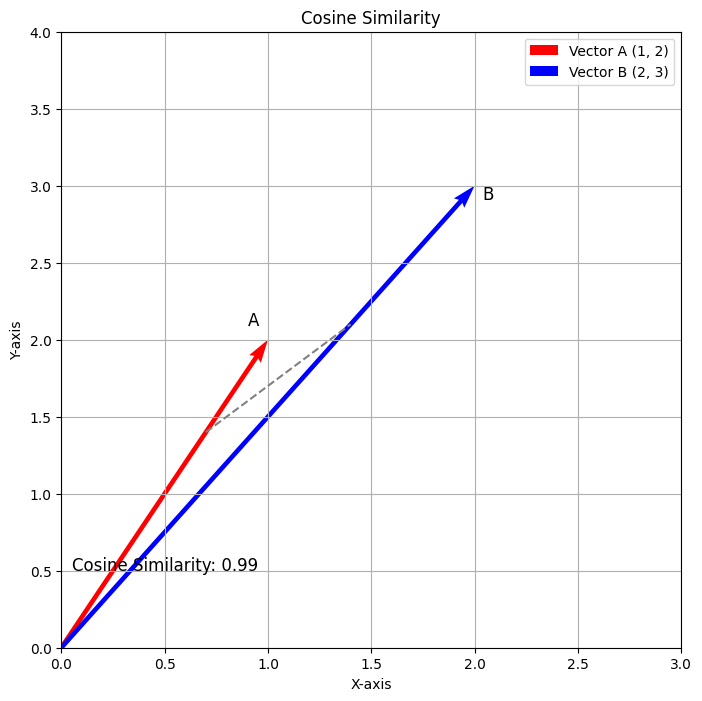
Upon executing this code it will generate the following output.

The plot above illustrates the Cosine Similarity between the vectors A(1,2) and B(2,3). The red vector denotes Vector A, and the blue vector denotes Vector B. The dashed line indicates the angle between the two vectors, with the calculated Cosine Similarity being approximately 0.98. This visualization effectively represents how Cosine Similarity measures the directional relationship between the two vectors.
# Use of Similarity Metrics in Vector Databases
Vector databases play a crucial role in recommendation engines and AI-driven analytics by transforming unstructured data into high-dimensional vectors for efficient similarity searches. Quantitative measurements such as Euclidean Distance and Cosine Similarity are used to compare these vectors, allowing systems to suggest appropriate content or identify irregularities. For instance, recommendation systems pair user likes with item vectors, offering customized recommendations.
MyScale (opens new window) leverages these metrics to power its MSTG (Multi-Scale Tree Graph) (opens new window) algorithm, which combines tree and graph-based structures to perform highly efficient vector searches, particularly in large, filtered datasets. MSTG is particularly effective in handling filtered searches, outperforming other algorithms like HNSW when the filtering criteria are strict, allowing for quicker and more precise nearest-neighbour searches.
The metric type in MyScale allows users to switch between Euclidean (L2), Cosine, or Inner Product (IP) distance metrics, depending on the nature of the data and the desired outcome. For example, in recommendation systems or NLP tasks, Cosine Similarity is frequently used to match vectors, while Euclidean Distance is favoured for tasks requiring spatial proximity like image or object detection.
By incorporating these metrics into its MSTG algorithm, MyScale optimizes vector searches across various data modalities, making it highly suitable for applications that need fast, accurate, and scalable AI-driven analytics
# Conclusion
To summarize, similarity measurements like Euclidean Distance and Cosine Similarity play a crucial role in machine learning, recommendation systems, and AI applications. Through the comparison of vectors representing data points, these metrics enable systems to uncover connections between objects, making it possible to provide personalized suggestions or recognize patterns in data. Euclidean Distance calculates the linear distance between points, whereas Cosine Similarity examines the directional correlation, with each having distinct benefits based on the specific scenario.
MyScale enhances the effectiveness of these similarity metrics through its innovative MSTG algorithm, which optimizes both the speed and accuracy of similarity searches. By integrating tree and graph structures, MSTG accelerates the search process, even with complex, filtered data, making MyScale a powerful solution for high-performance AI-driven analytics, large-scale data handling, and precise, efficient vector searches.


